In this article, we cover wide range of worksheets on the topics including number lines, co-ordinate planes and basic graph plotting.
Kids would definitely enjoy these worksheets. Don’t forget to check our graph plotting worksheets – they are really fun to do!
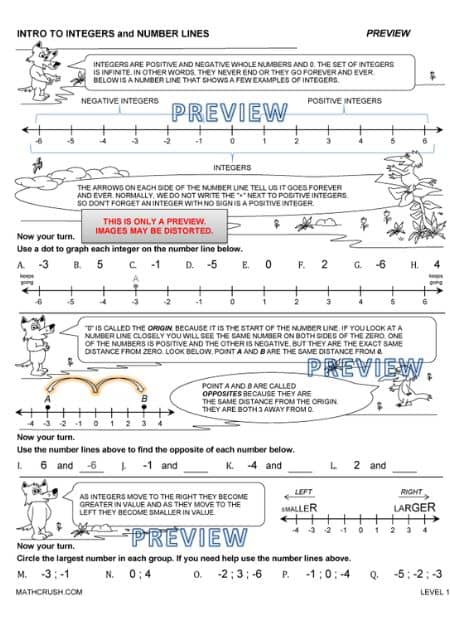
Intro to Integers and Number Lines Level 1
This one page worksheet introduces integers and graphing them on number lines. It includes help and examples to guide students to a better understanding of the concept.
Key concept: Students need to understand integers (positive and negative whole numbers), their values, and their positions on a number line.
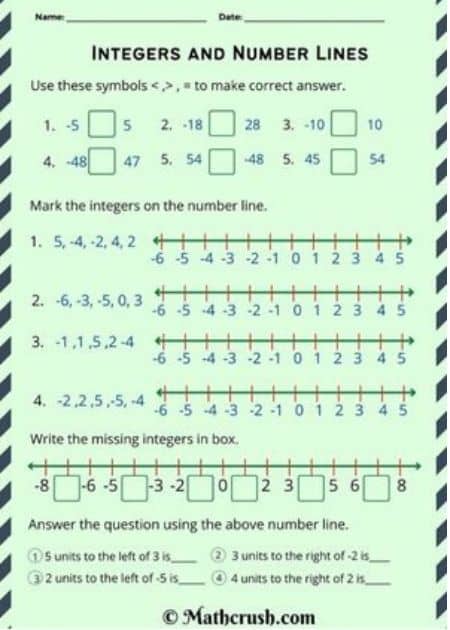
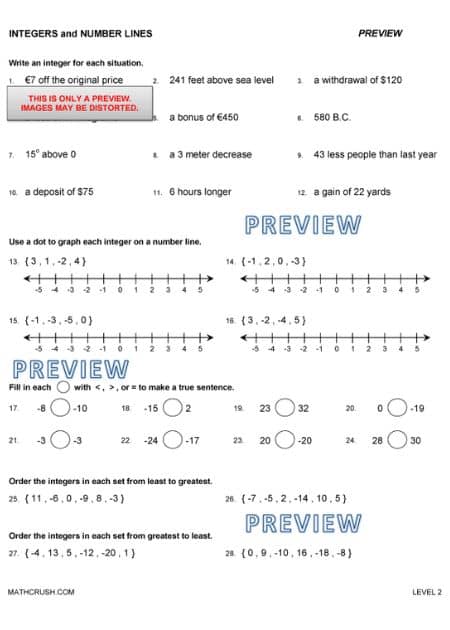
Integers and Number Lines Level 2
This one page worksheet covers integers. It includes using integers to describe a statement; number lines; greater than, less than, and equal; and least to greatest and greatest to least.
Key concept: Students need to understand integers (positive and negative whole numbers), their values, and their positions on a number line.
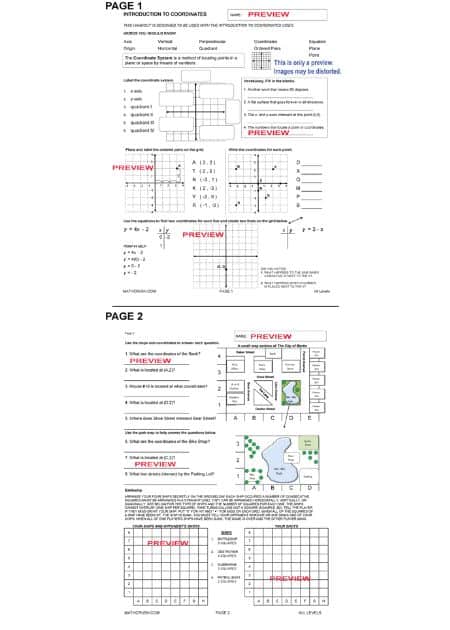
Introduction to Coordinates – Video3
This is our third video and it covers coordinates. The video is meant to be used as an introduction or review video. It introduces coordinates and graphing, and how it is used in the real world. Use the handout as an additional resource for students while they watch the video.
NOTE: The video link below will take you to VIMEO. It is a website where the video is being hosted.
Video
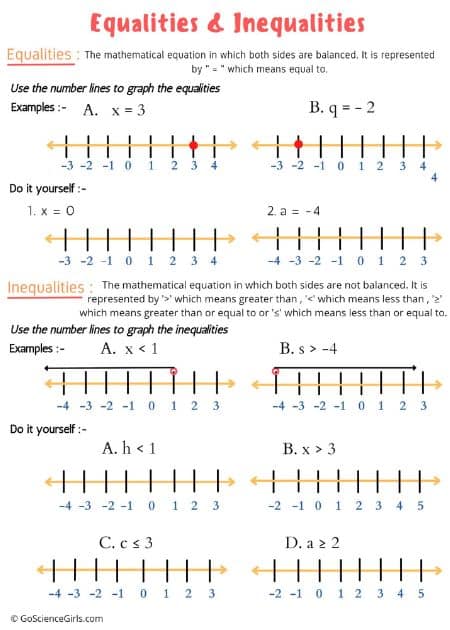
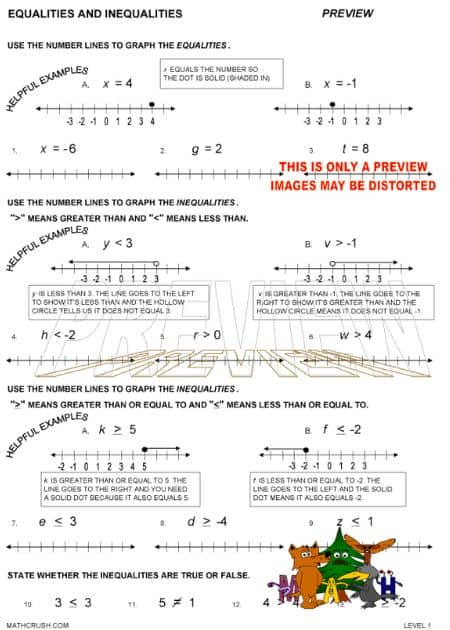
Graphing Equalities and Inequalities Level 1
This one page worksheet has students graph basic equalities and inequalities on number lines.
Student misunderstanding: When to use a filled or hollow circle. If an inequality is equal to the number than the circle has to be filled and if it’s only greater than or less than it needs to be hollow.
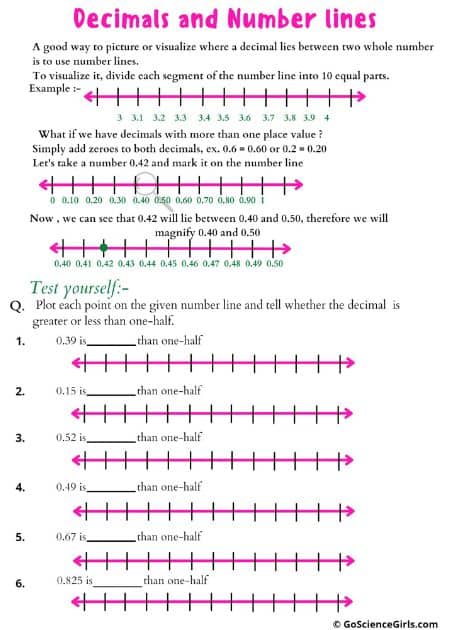
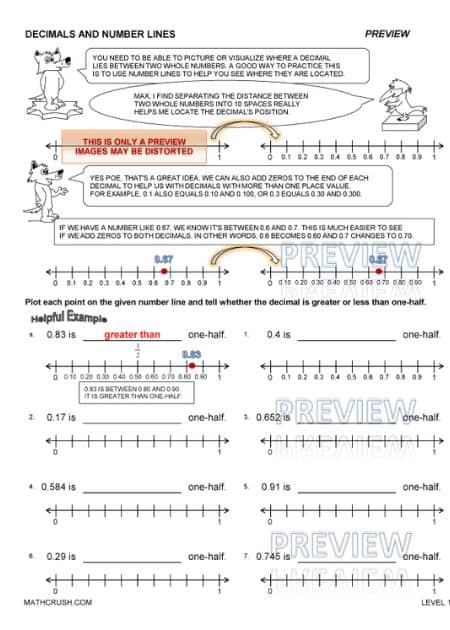
Decimals and Number Lines Level 1
This one page worksheet introduces decimals. It uses number lines to help students visualize where decimals lie between two whole numbers. Students plot the decimal and write if it is greater or less than one-half.
Key concept: Students need to understand the value of a decimal and where it is located between two whole numbers.
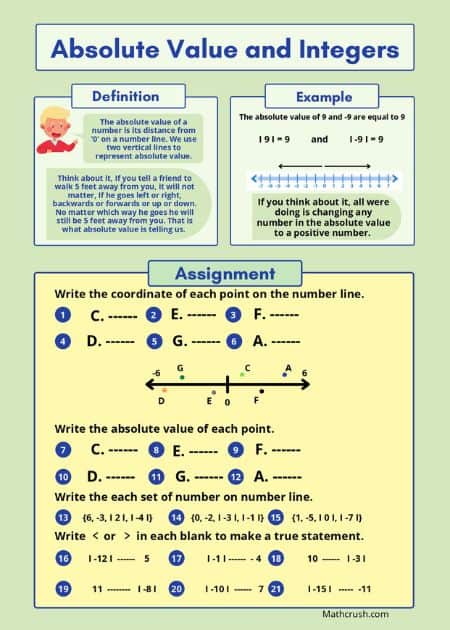
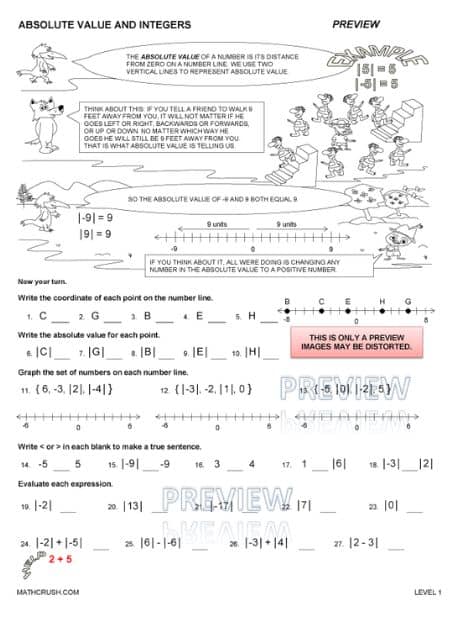
Absolute Value and Number Lines Level 1
This one page worksheet introduces absolute value and reviews number lines. It explains what is the absolute value of a number and includes problems with number lines, greater than and less than, and solving simple expressions.
Student misunderstanding: The absolute value of a number is always positive not its opposite.
Example: | 3 | = 3 not -3.
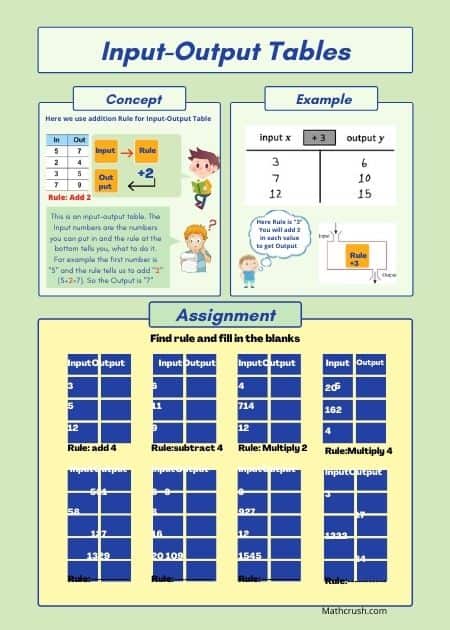
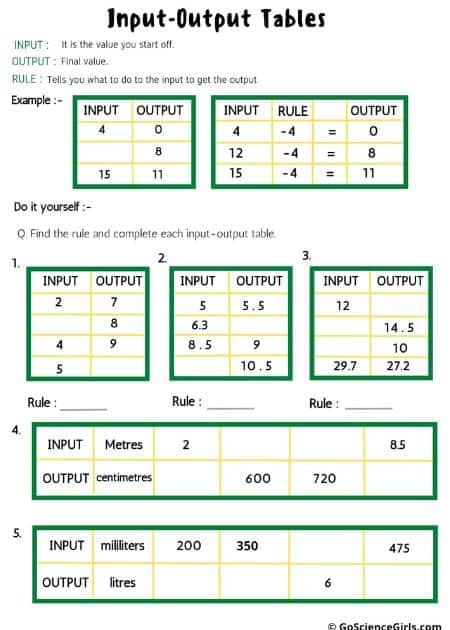
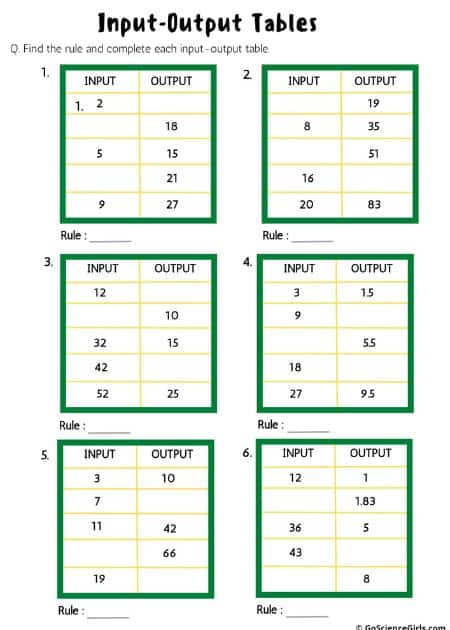
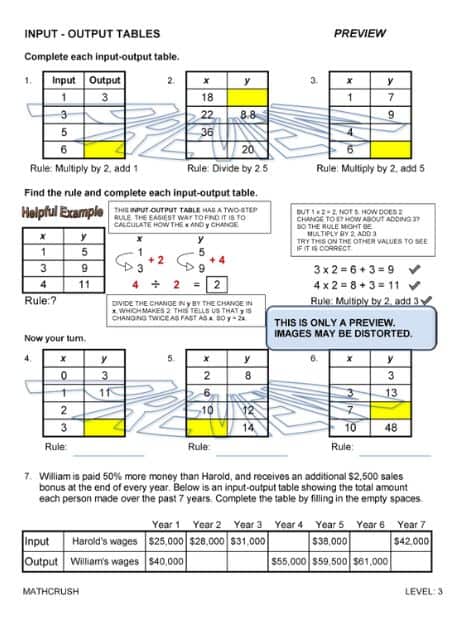
Input – Output Tables Worksheet
These one page worksheets cover input-output tables. Students need to find the rules and complete the tables. Input-output tables help students recognize patterns and build a relationship between lines and equations. There is a different worksheet for each level.


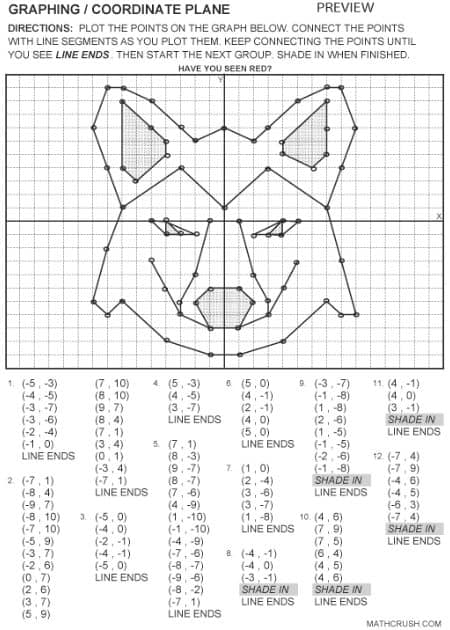
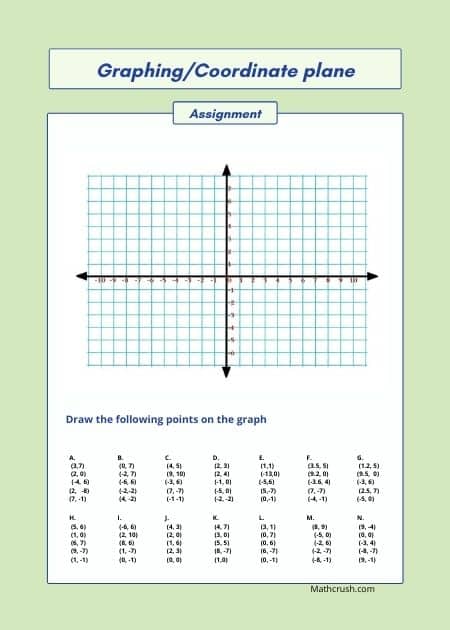
Graphing / Coordinate Plane – Worksheet
This one page worksheet is on plotting ordered pairs. Students graph and connect the
points to create a picture.
Student misunderstanding: Which number is the x-axis and which one is the y-axis? Have to go into
the elevator before you can go up or down, or have to move the ladder before you climb it. So the first number is the x-axis (number going across).
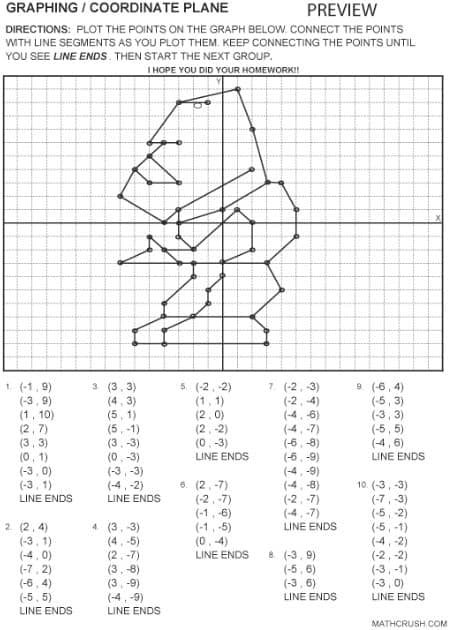
Graphing / Coordinate Plane – Worksheet B
This one page worksheet is on plotting ordered pairs. Students graph and connect the
points to create a picture.
Student misunderstanding: Where is the origin? The origin is where the x-axis and y-axis cross.
It is also where the zero goes for both axes.
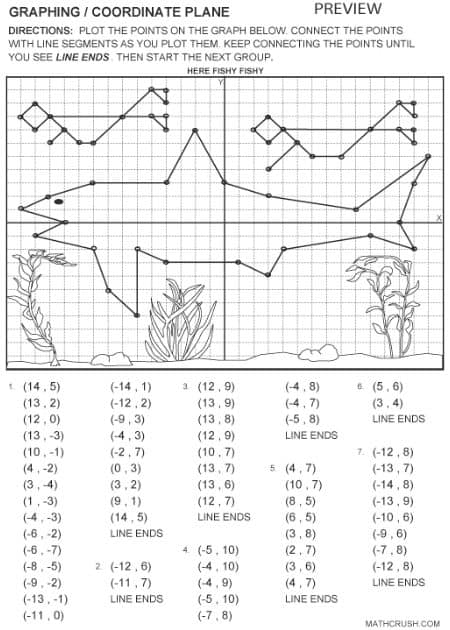
Graphing / Coordinate Plane – Worksheet C
This one page worksheet is on plotting ordered pairs. Students graph and connect the
points to create a picture.
Student misunderstanding: Which number is the x-axis and which one is the y-axis? Have to go into
the elevator before you can go up or down, or have to move the ladder before you climb it. So the first number is the x-axis (number going across).
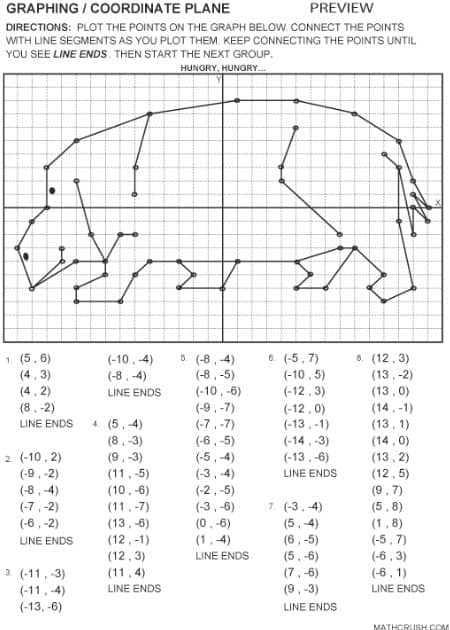
Graphing / Coordinate Plane – Worksheet D
This one page worksheet is on plotting ordered pairs. Students graph and connect the
points to create a picture.
Student misunderstanding: Where is the origin? The origin is where the x-axis and y-axis cross.
It is also where the zero goes for both axes.
Graphing / Coordinate Plane – Worksheet E
This one page worksheet is on plotting ordered pairs. Students graph and connect the
points to create a picture.
Student misunderstanding: Which number is the x-axis and which one is the y-axis? Have to go into
the elevator before you can go up or down, or have to move the ladder before you climb it. So the first number is the x-axis (number going across).
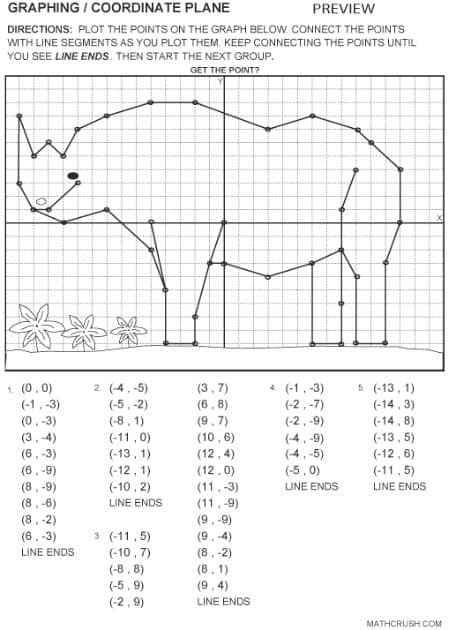
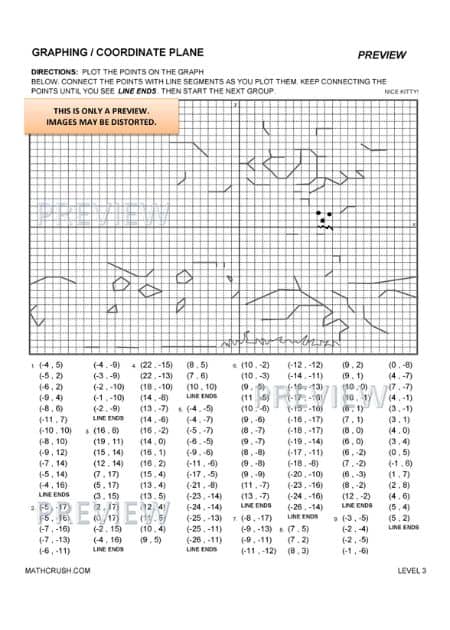
Graphing / Coordinate Plane Worksheet – F Level 3
This one page worksheet is on plotting ordered pairs. Students graph and connect the
points to create a picture.
Student misunderstanding: Origin? The origin is where the x-axis and y-axis intersect. It is also where the zero goes for both axes.
The x-axis and y-axis? The first number is the x-axis. Have to go into the elevator before you can go up or down, or have to move the ladder before you climb it.
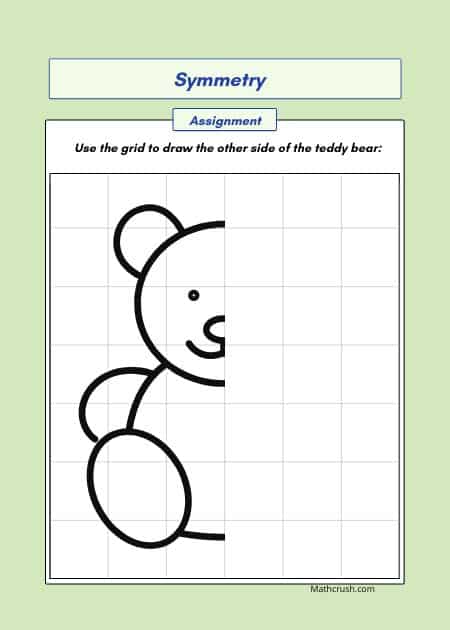
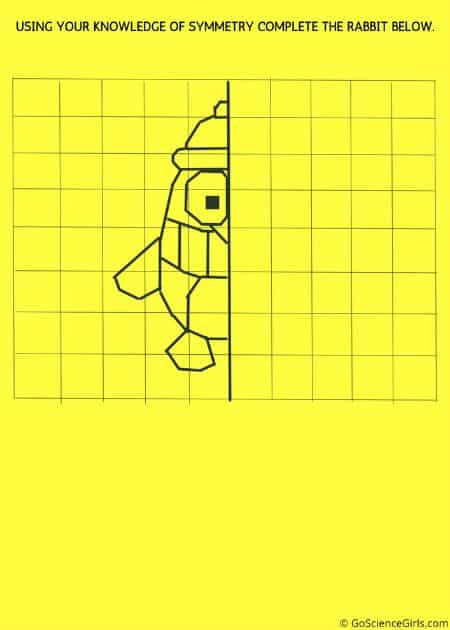
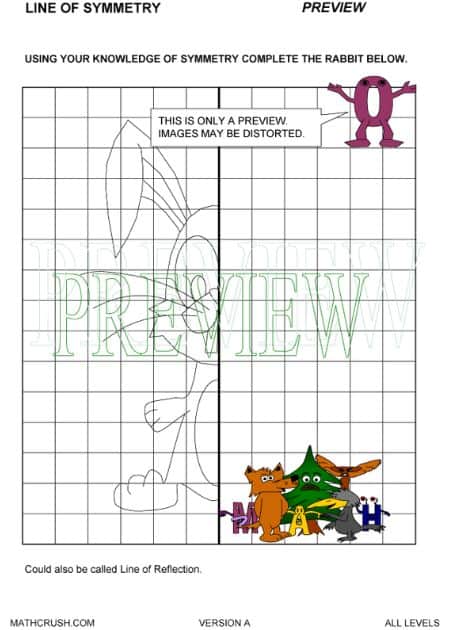
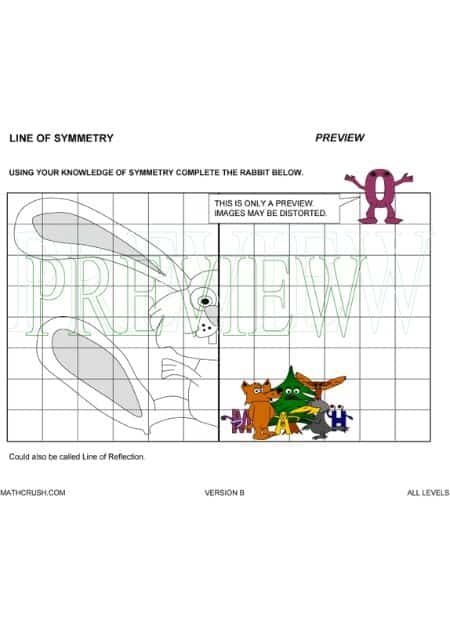
Line of Symmetry Art Worksheet – All Levels
These one page Easter worksheets use line of symmetry and art to review student knowledge. Students re-draw the second half of the shape to create the full rabbit.
Key concept: Line of symmetry is a line such that if a figure is folded about the line, then one half of the figure matches the other half.
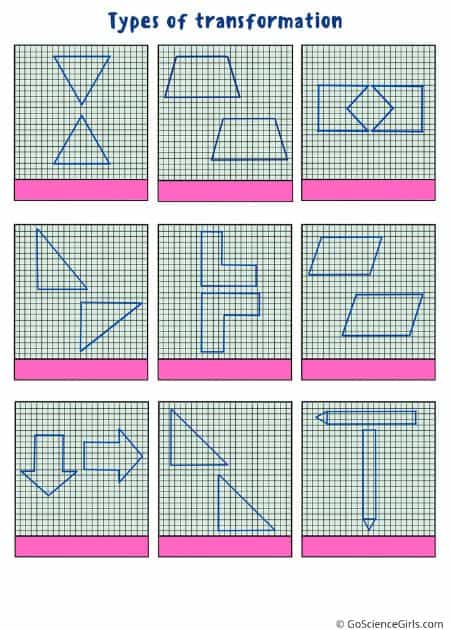
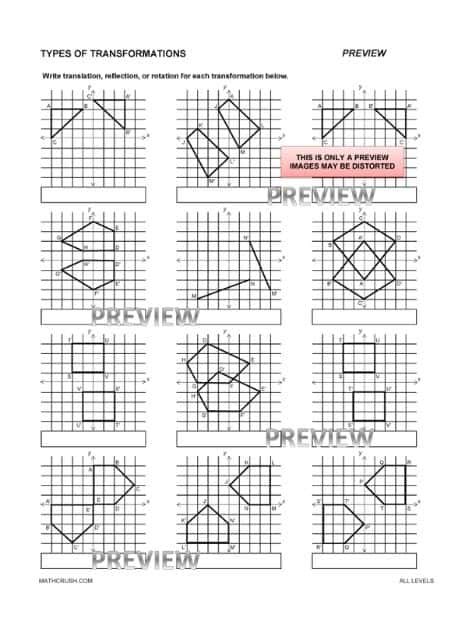
Types of Transformations Worksheet – All Levels
This one page worksheet covers the three transformations; translation, reflection, and rotation. Students need look at the figure and the transformation and write which one occurred.
Key concept: Students should be able to visualize an object and what it would look like if it was flipped, slid, or rotated.
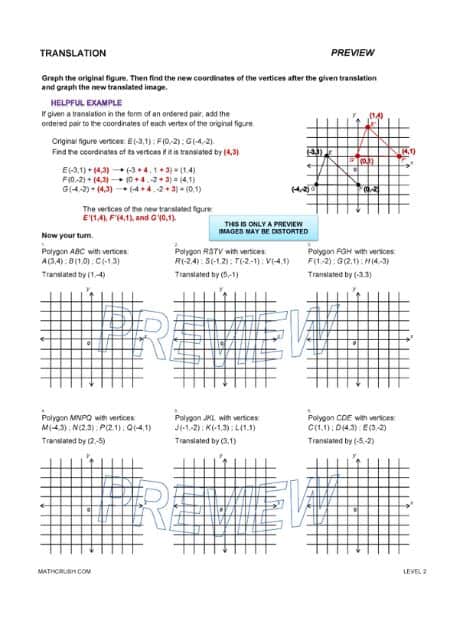
Translation Worksheet – Level 2
This one page worksheet covers translation. Students are given a polygon’s vertices and a translation in the form of an ordered pair. They must use this information to graph the original figure and the new translated shape.
Key concept: Students need to be able to visualize objects and their movement.
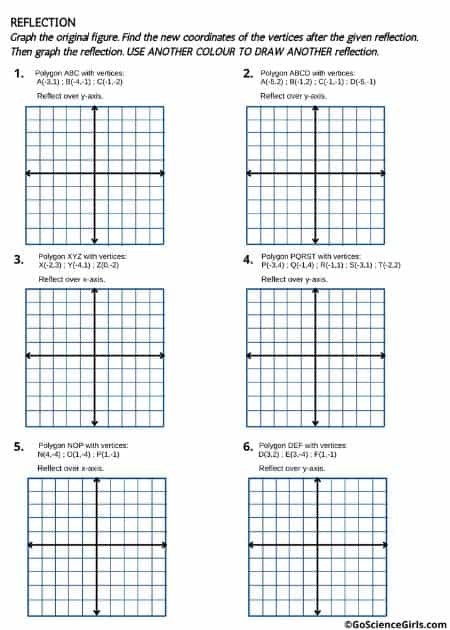
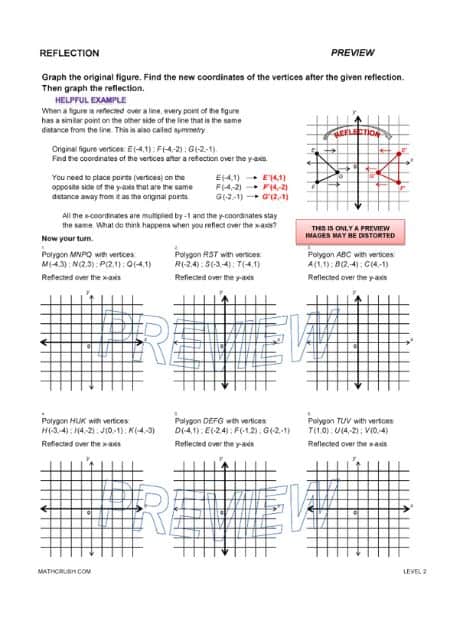
Reflection Worksheet – Level 2
This one page worksheet covers reflection. Students are given a polygon’s vertices and a reflection over the x-axis or y-axis. They must use this information to graph the original figure and the new reflected shape.
Key concept: Students need to be able to visualize objects and their reflection.
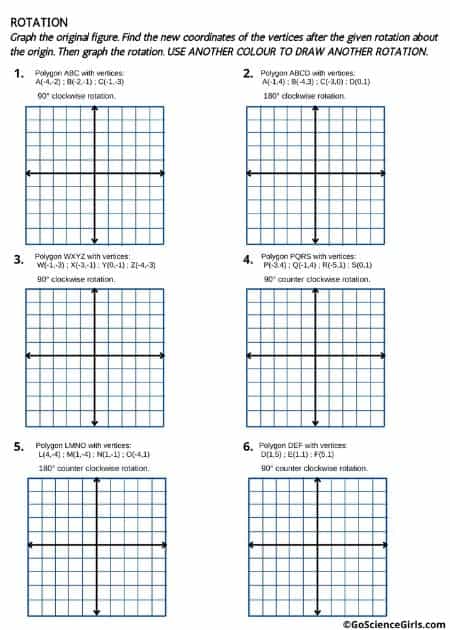
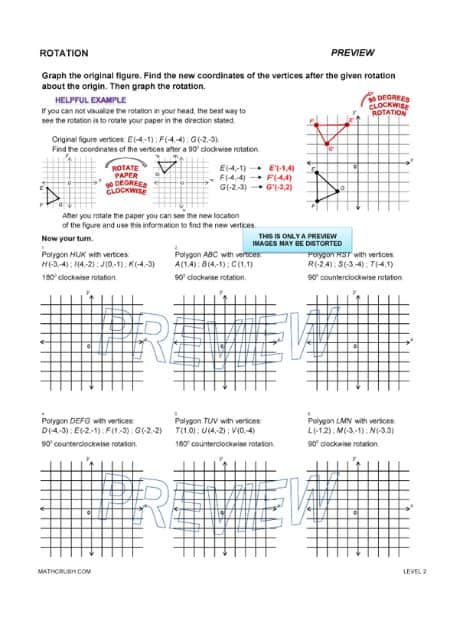
Rotation Worksheet – Level 2
This one page worksheet covers rotation. Students are given a polygon’s vertices and a rotation about the origin. They must use this information to graph the original figure and the new rotated
shape.
Key concept: Students need to be able to visualize objects and their rotation.
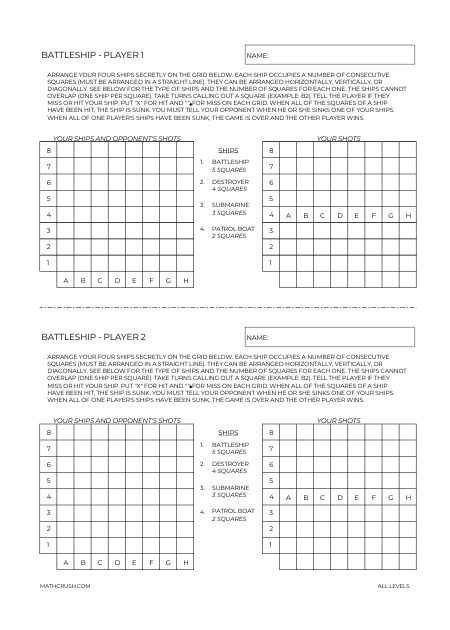
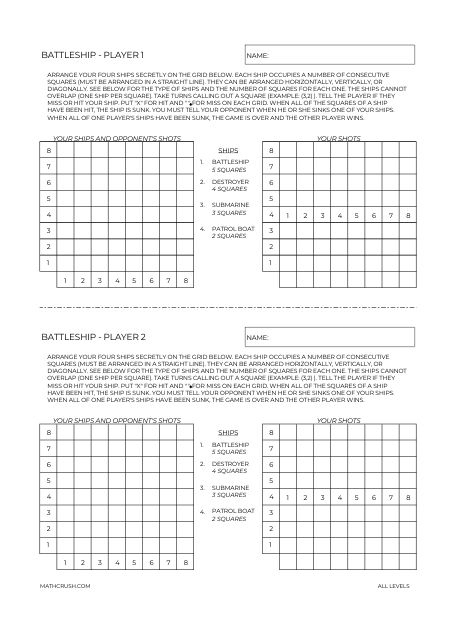
Battleship Game Worksheet – All Levels
BATTLESHIP! Just like the original game, kids try and sink each other’s ships by calling out coordinates.
Key concept: Help practice the coordinate system and remember that the horizontal axis comes before the vertical axis.
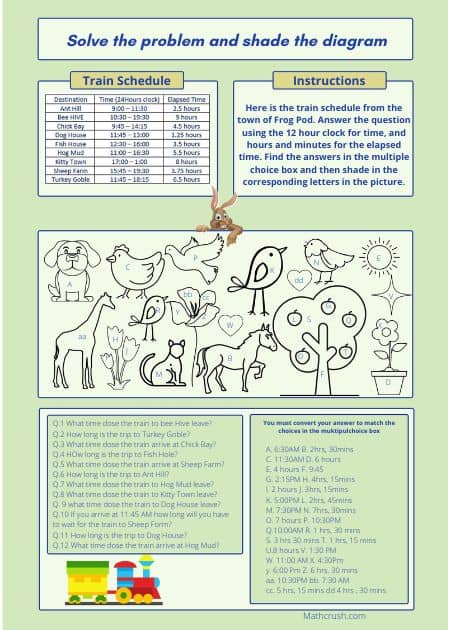
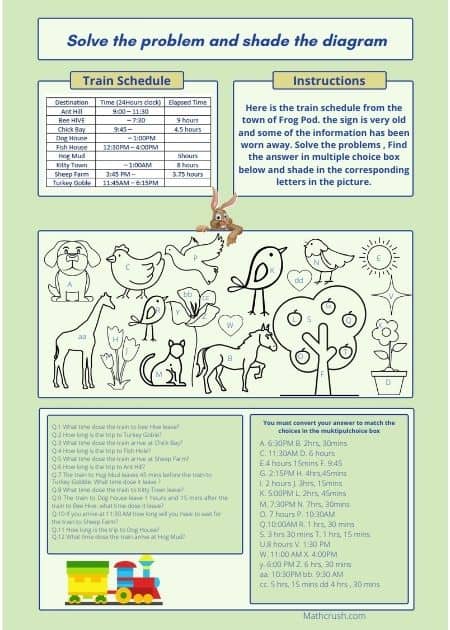
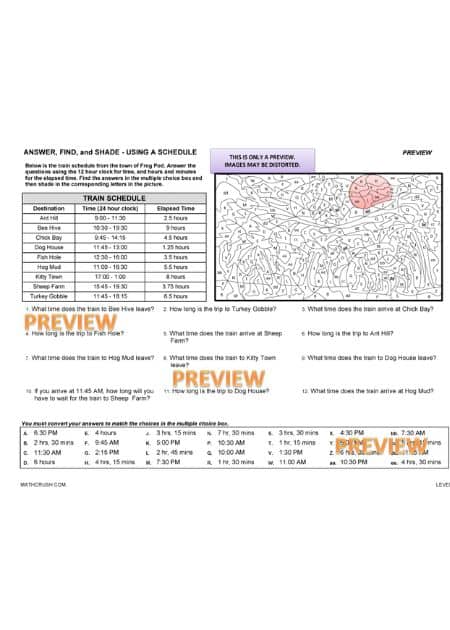
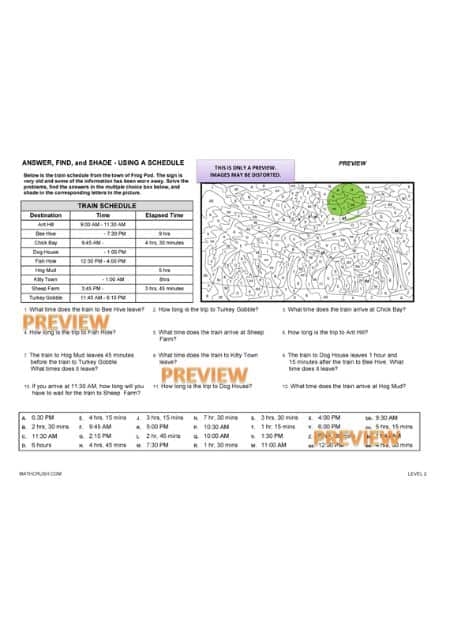
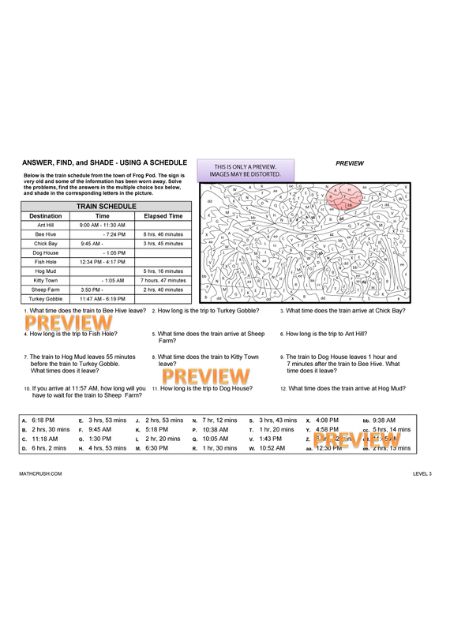
Answer, Find, and Shade Using and Reading a Schedule
These one page art worksheets have students practice reading a schedule. The schedule and picture become more difficult as the levels get higher. For example: Information is left out of the schedule and students must calculate what is missing.
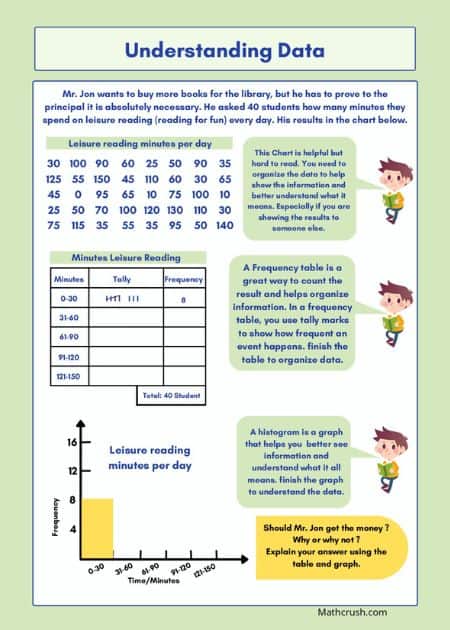
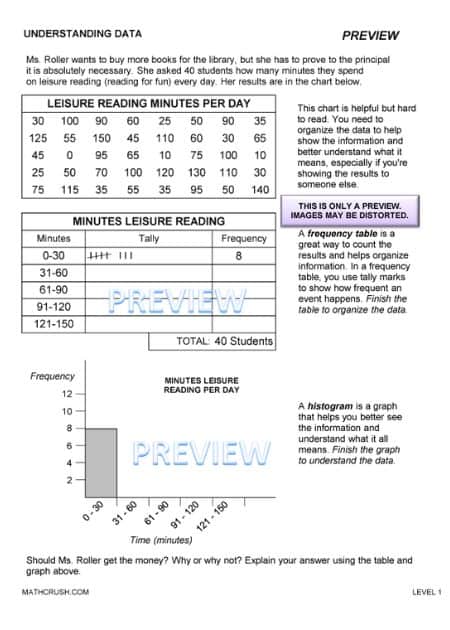
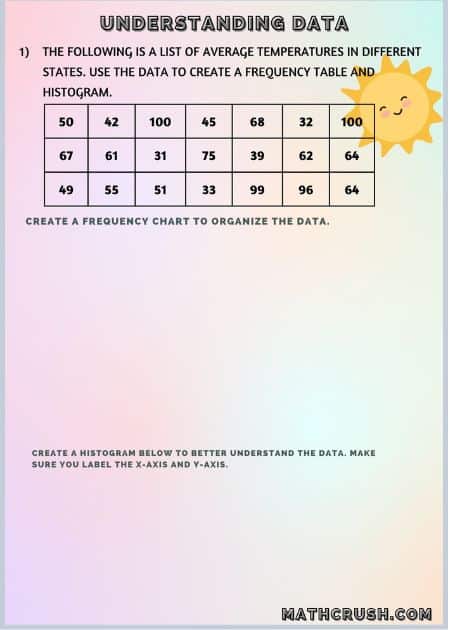
Understanding Data Worksheet – Level 1
This one page worksheet introduces tables and graphs. Students need to finish a frequency table and histogram and use the information to answer a question.
Key concept: Students need to be able to create and understand tables and graphs and use the information to clarify data.
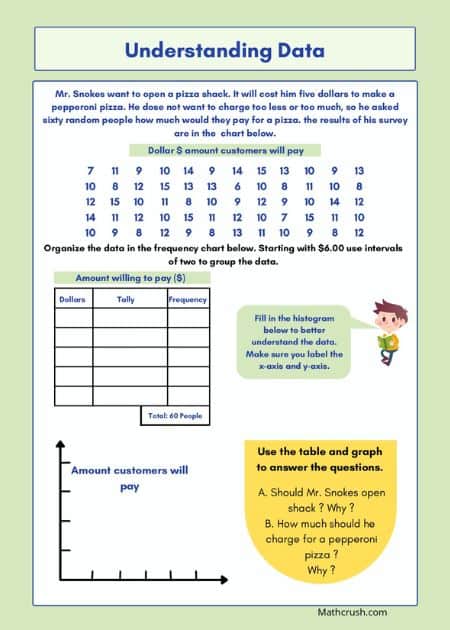
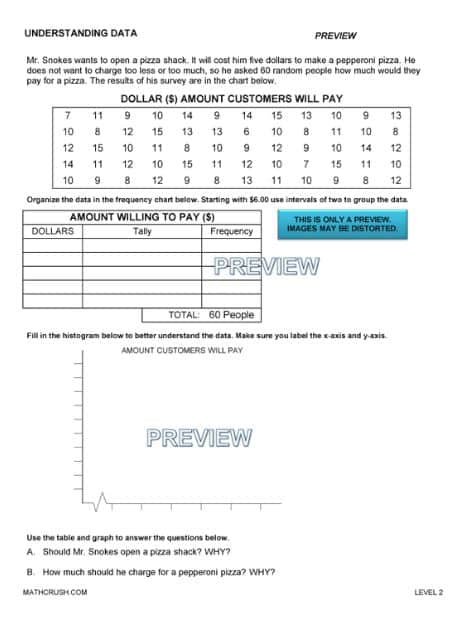
Understanding Data Worksheet – Level 2
This one page worksheet continues tables and graphs. Students fill in the frequency table and histogram and use the information to answer a question.
Key concept: Students need to be able to create and understand tables and graphs and use the information to clarify data.
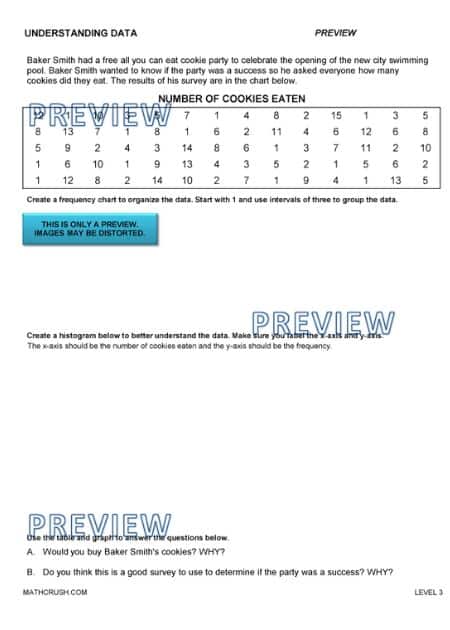
Understanding Data Worksheet – Level 3
This one page worksheet covers tables and graphs. Students create a frequency table and histogram and use the information to answer questions.
Key concept: Students need to be able to create and understand tables and graphs and use the information to clarify data. They should also be able to recognize whether the data is important, related to the topic, and if it is a good resource to make decisions, especially when dealing with samples.
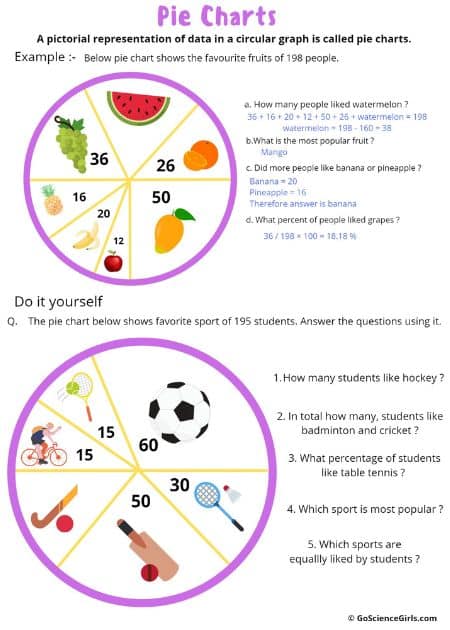
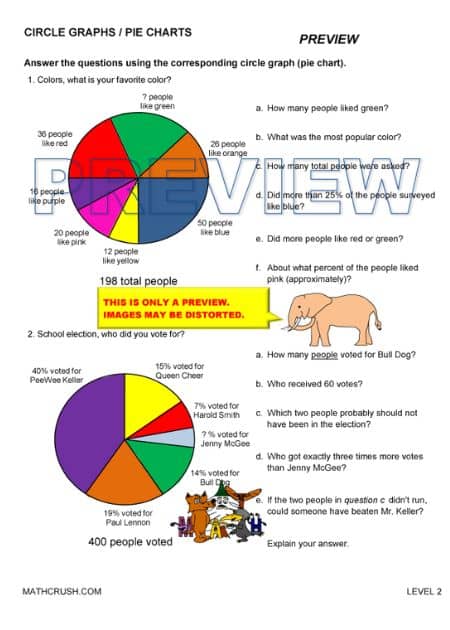
Circle Graphs Worksheet – Level 2
This one page worksheet covers circle graphs / pie charts. It includes two graphs which students need to answer questions about. One uses numbers to describe the group and the other uses percents.
Key concept: Circle graphs / pie charts represent 100%, and can be used to better visualize an entire group.
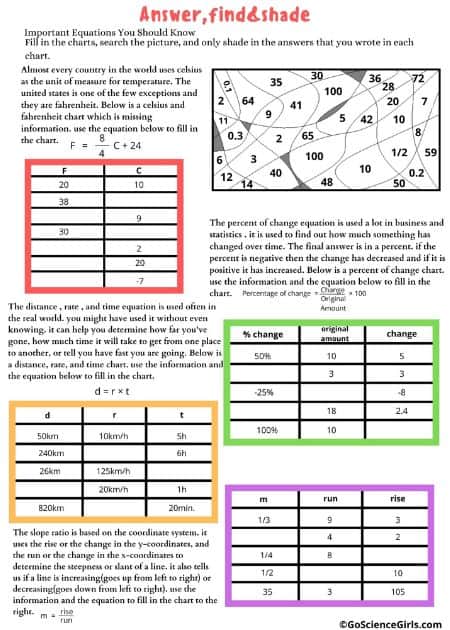
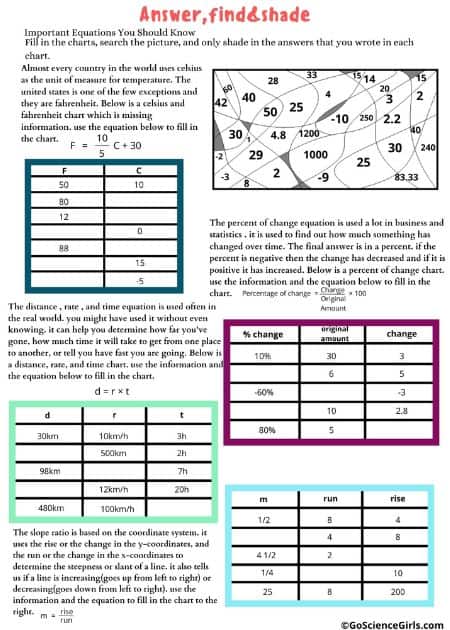
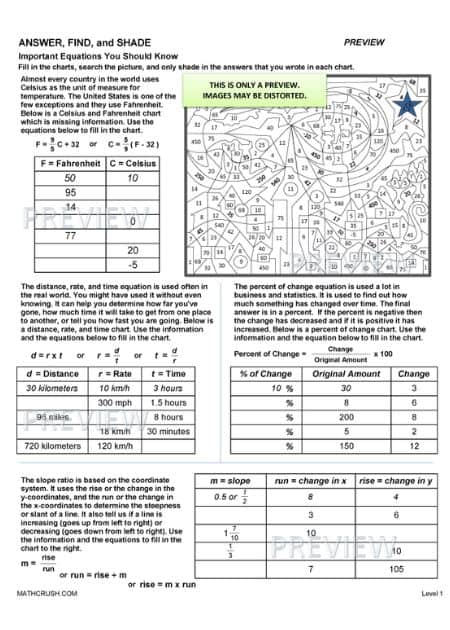
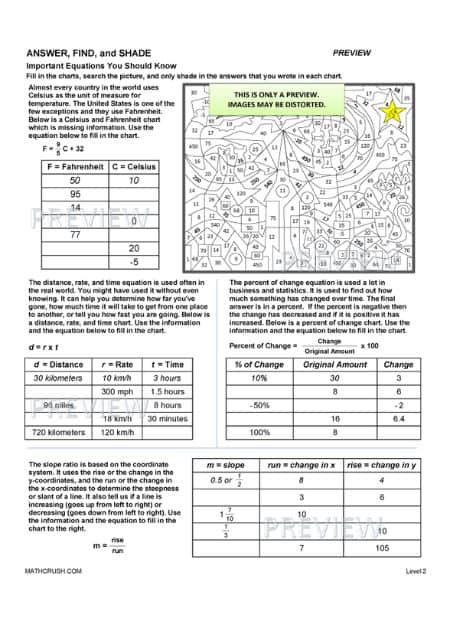
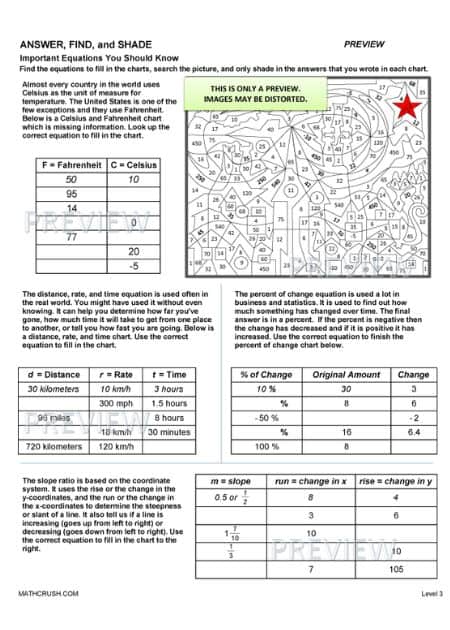
Answer, Find, and Shade Important Equations You Should Know – Worksheet
These one page art worksheets review solving equations, substitution, charts, and learning real world equations. Students are given a chart and must fill in the empty spaces. Level one and two include equations to help students, but the level 3 worksheet makes students research or use prior knowledge.
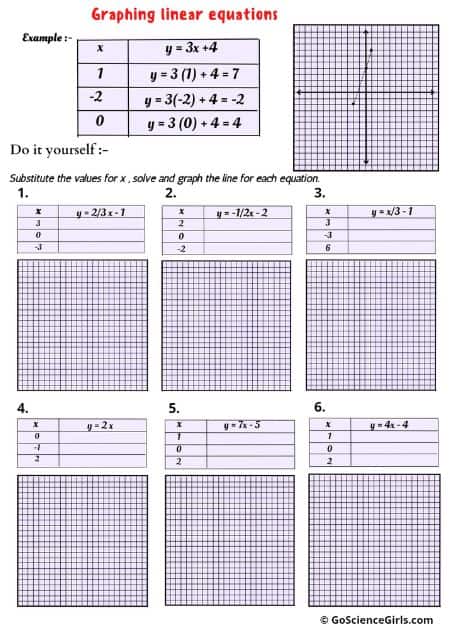
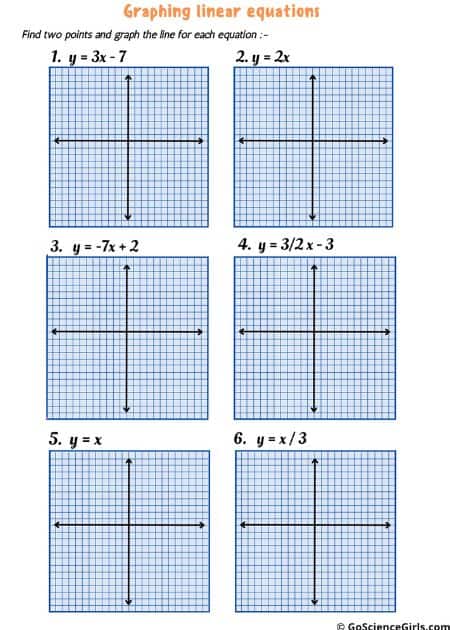
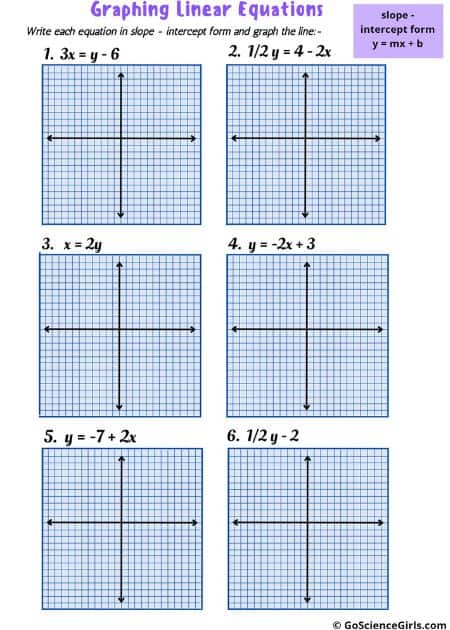
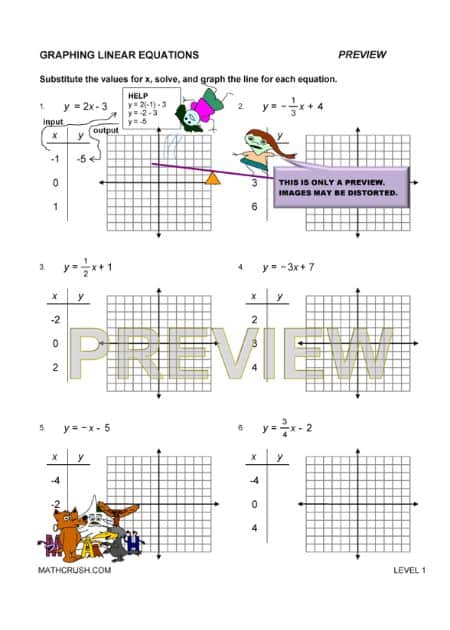
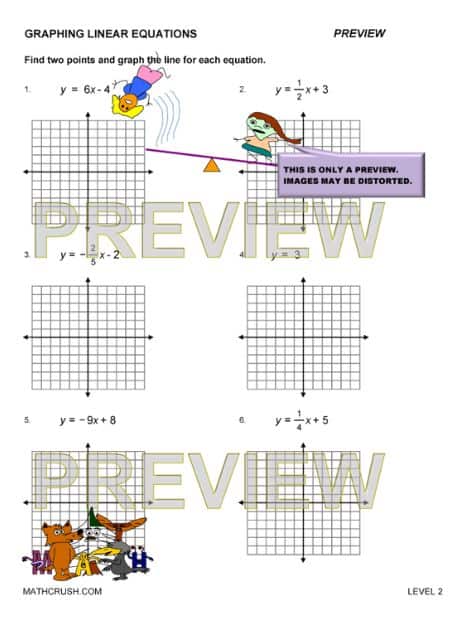
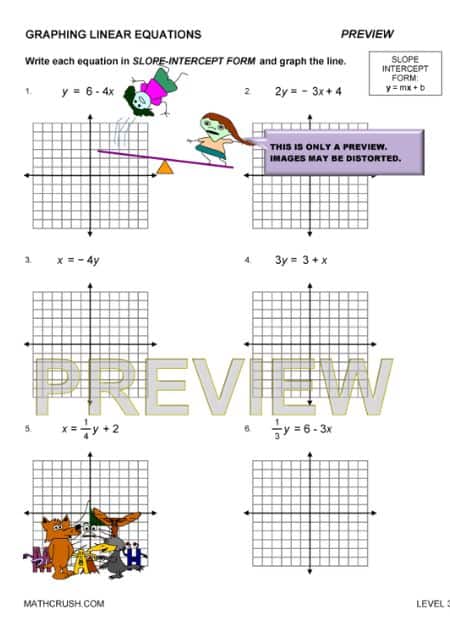
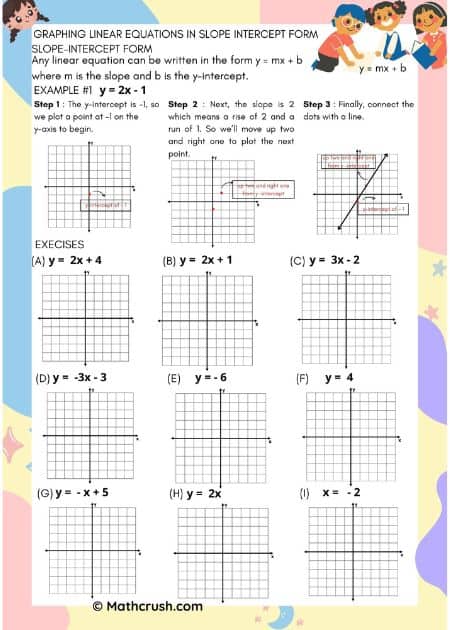
Graphing Linear Equations Worksheet
These one page worksheets cover graphing linear equations. Students find points for each equation and graph the line on the given grid. There is a different worksheet for each level.
Key concept: Equations can describe real world objects like simple lines.
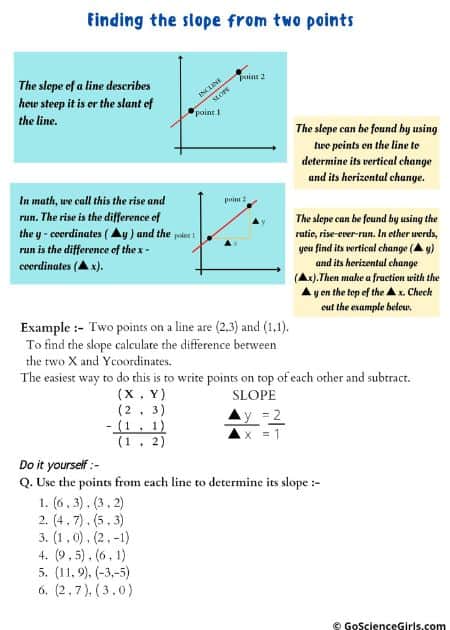
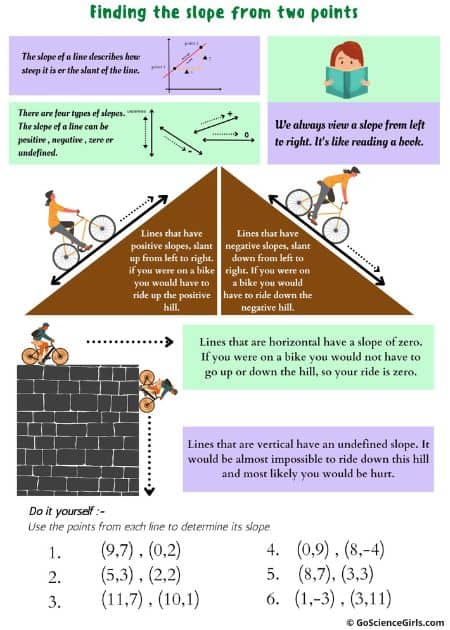
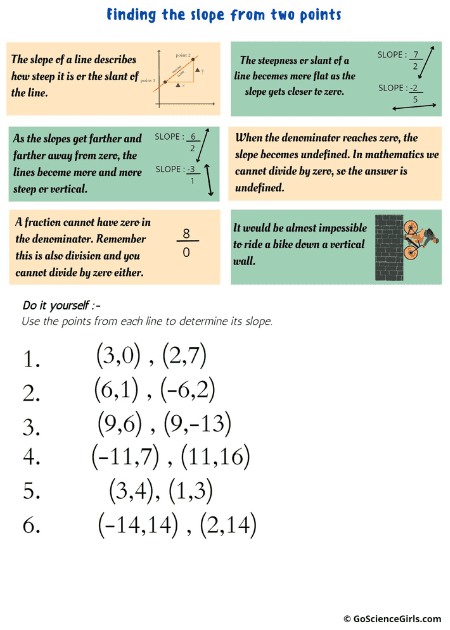
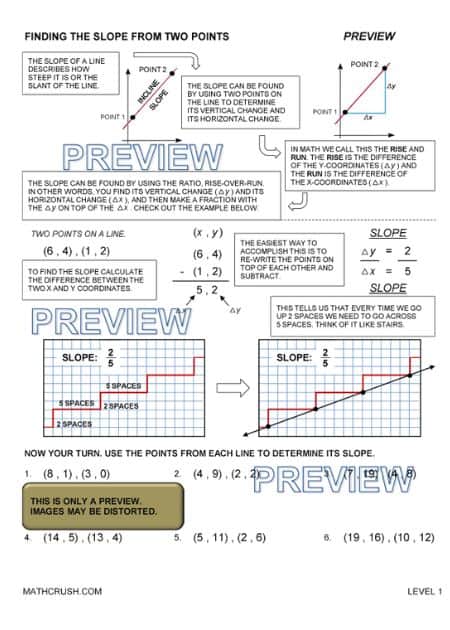
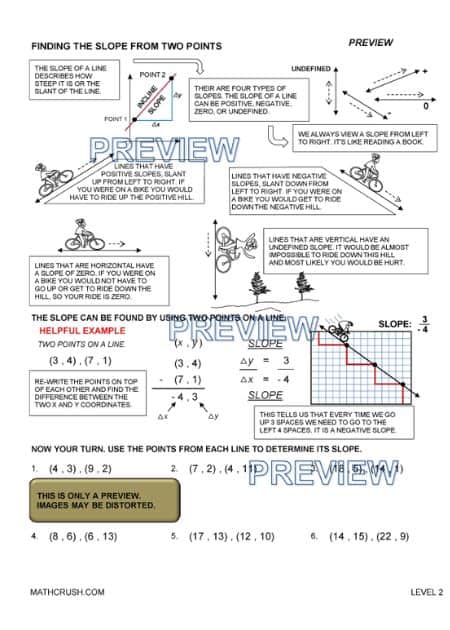
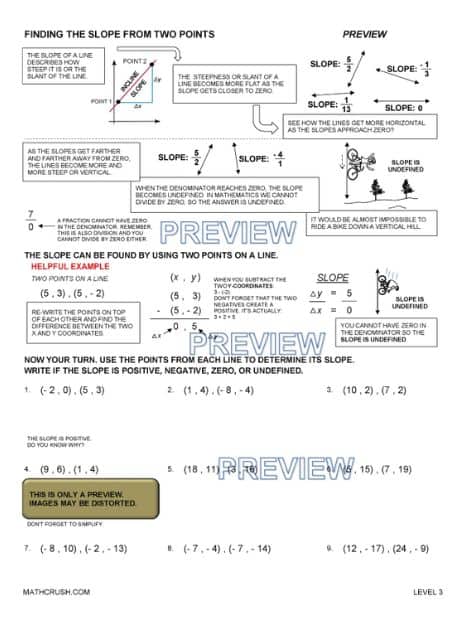
Finding the Slope from Two Points Worksheet
These one page, help pages introduce the slope of a line and how to calculate the slope from two points.
Student misunderstanding: What goes on top? The ratio is rise-over-run or the change in y over the change in x.
Pythagorean Theorem Video – All Levels
This video covers the pythagorean theorem. It explains what the theorem is and how it can be used. The video includes examples and additional review to help students better understand the theorem and how to use it in everyday life. In the Geometry Worksheets section there are four different handouts that can be used as additional resources for students while they watch the video.
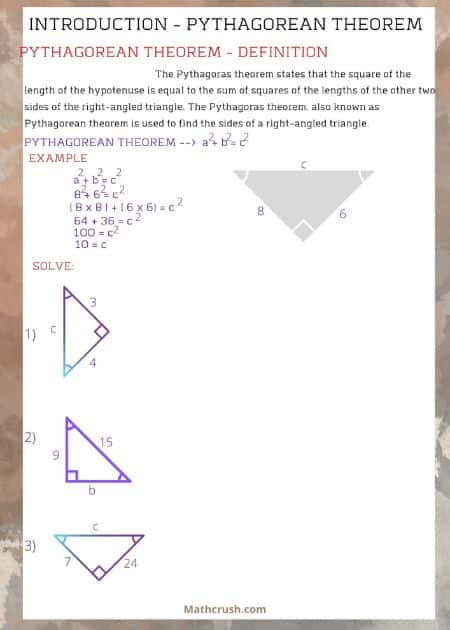
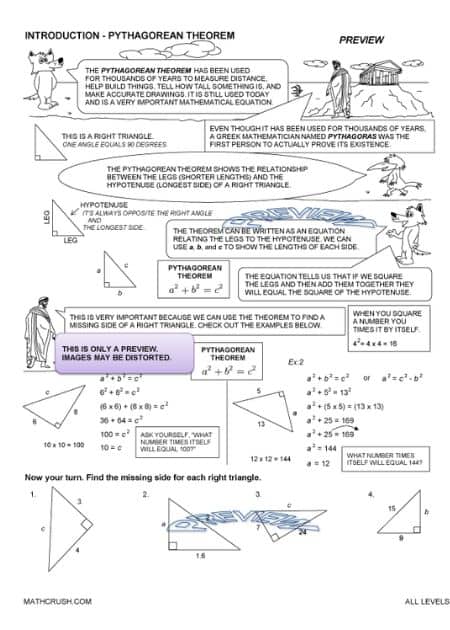
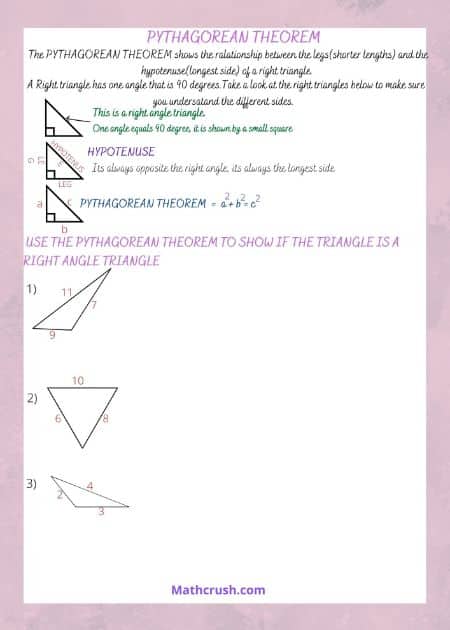
Introduction – Pythagorean Theorem Worksheet – All Levels
This one page worksheet introduces the Pythagorean Theorem. Students should already know the square and square root of a number, solving basic equations, and triangles.
Key concept: It is a very important theorem in the real world. It is used in construction, drafting, measuring distance, calculating the height of large objects, etc. etc.
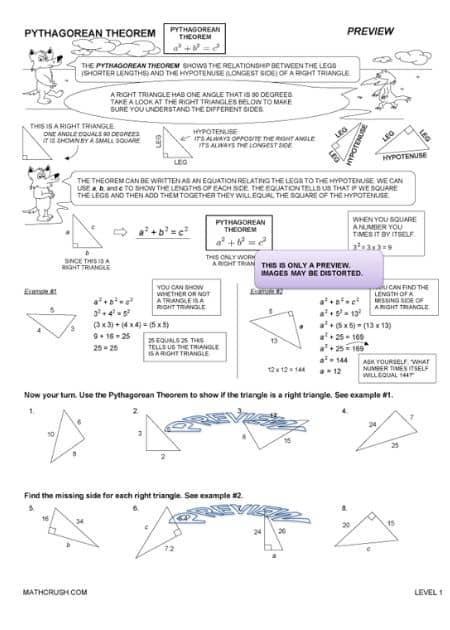
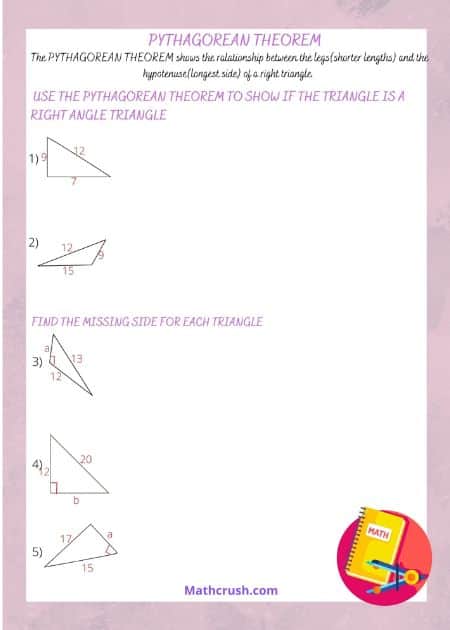
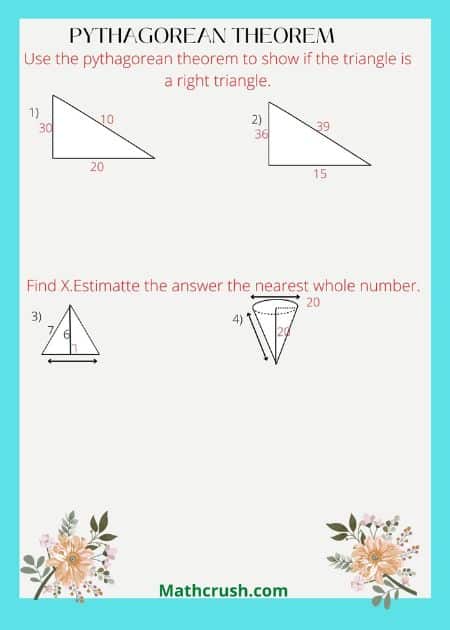
Pythagorean Theorem Worksheet – Level 1
This one page worksheet introduces the Pythagorean Theorem. Students should already know the square and square root of a number, solving basic equations, and triangles.
Key concept: It is a very important theorem in the real world. It is used in construction, drafting, measuring distance, calculating the height of large objects, etc. etc.
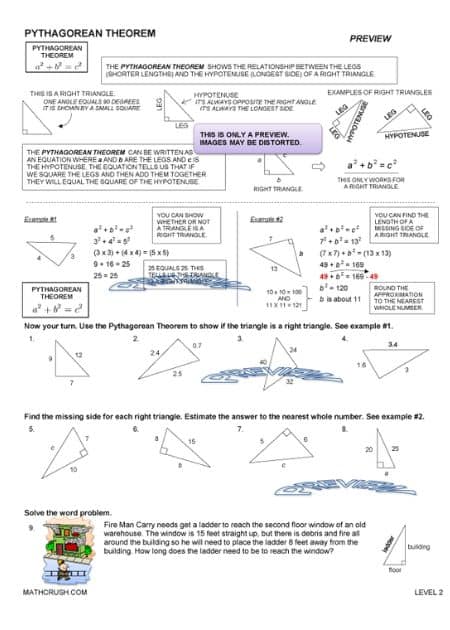
Pythagorean Theorem Worksheet – Level 2
This one page worksheet continues the Pythagorean Theorem. Students should already know the square and square root of rational and irrational numbers, solving basic equations, and triangles.
Help: If students do not know how to estimate irrational numbers (squares of not perfect squares) have them review Estimating Square Roots.
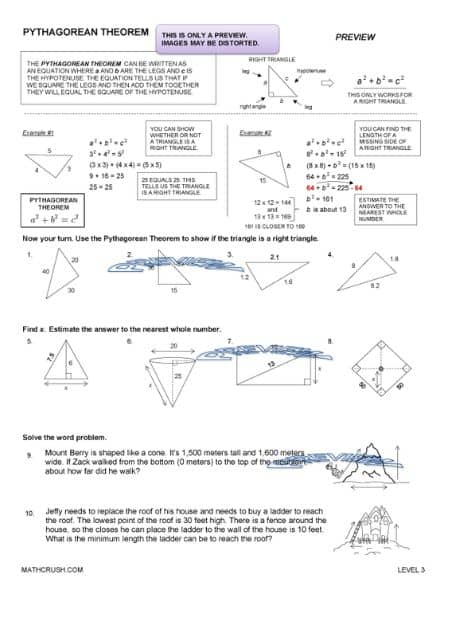
Pythagorean Theorem Worksheet – Level 3
This one page worksheet continues the Pythagorean Theorem. Students should already know the square and square root of rational and irrational numbers, solving basic equations, and triangles. Some of the problems have students using the theorem to find a missing side on a non-triangular shape.
Student misunderstanding: Some of the problems are not triangles but they need to use prior knowledge and the Pythagorean Theorem to solve.
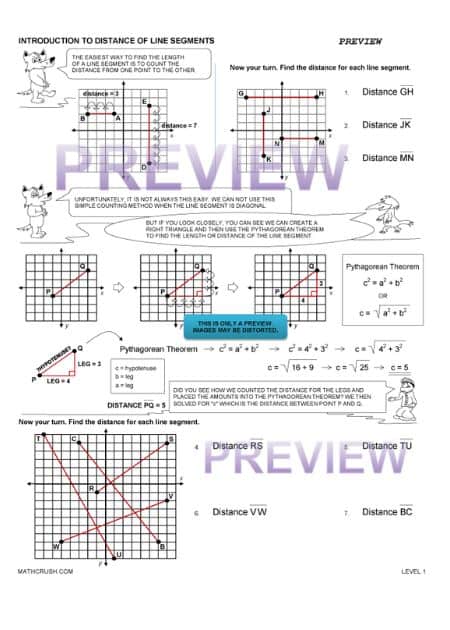
Intro to Distance of Line Segments Worksheet Level 1
This one page worksheet introduces finding the distance of a line segment using a graph. It uses the Pythagorean Theorem to help students better understand how to find the distance.
Prior Knowledge: Students should already know the Pythagorean Theorem which will lead into the Distance Formula.
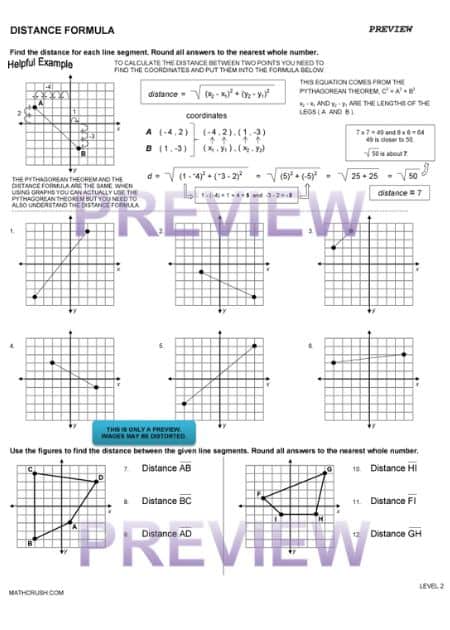
Distance Formula Worksheet – Level 2
This one page worksheet covers the Distance Formula. Students are given two coordinates and a line segment and need to find the distance. Even though students can use the Pythagorean Theorem, they also need to understand and use the Distance Formula.
Key concept: Students should be able to use their prior knowledge of the Pythagorean Theorem to understand the Distance Formula.
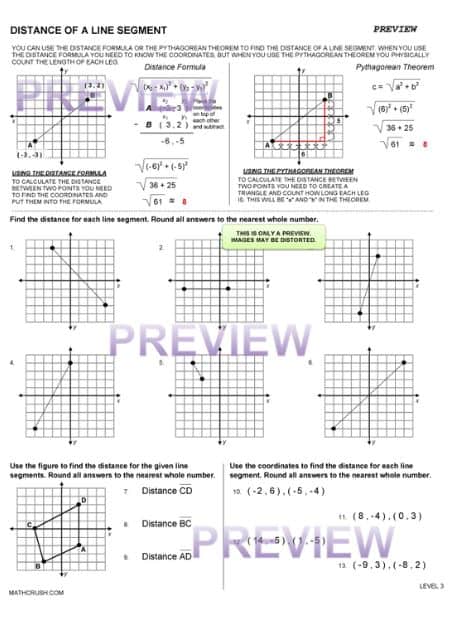
Distance of a Line Segment Worksheet – Level 3
This one page worksheet allows students to use the Distance Formula or the Pythagorean Theorem to find the distance of a line segment. The problems include line segments on graphs and two coordinates with no graph.
Key concept: Students should be able to find the distance of a line segment, and understand the relationship between the Pythagorean Theorem and the Distance Formula.
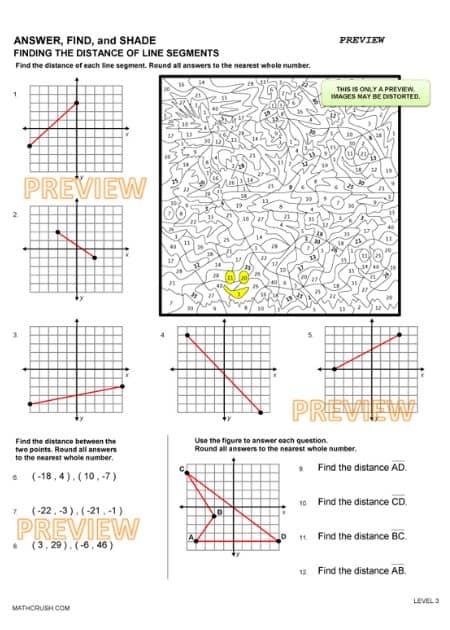
Answer, Find, and Shade – Level 3
Distance of a Line Segment Worksheet
This one page art worksheet reviews finding the distance of a line segment. Students will need to know the Distance Formula, but also can use the Pythagorean Theorem on most of the problems. The problems include line segments on graphs and two coordinates with no graph.
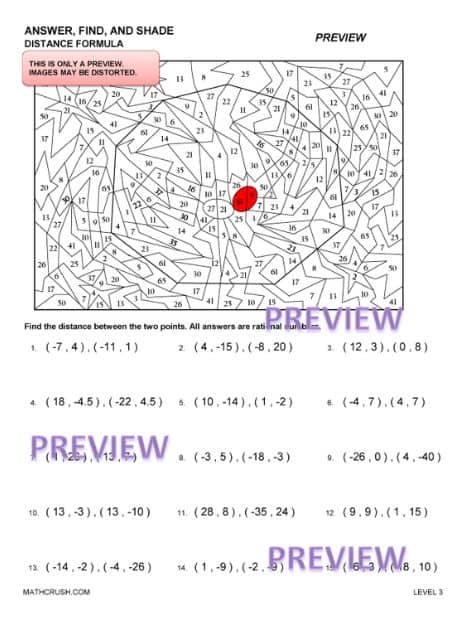
Answer, Find, and Shade Distance Formula Level 3
This one page art worksheet reviews the distance formula. Students find the distance between two points. All answers are rational numbers. This worksheet can also be used during Halloween.
Helpful idea: Students should be allowed to use a calculator.
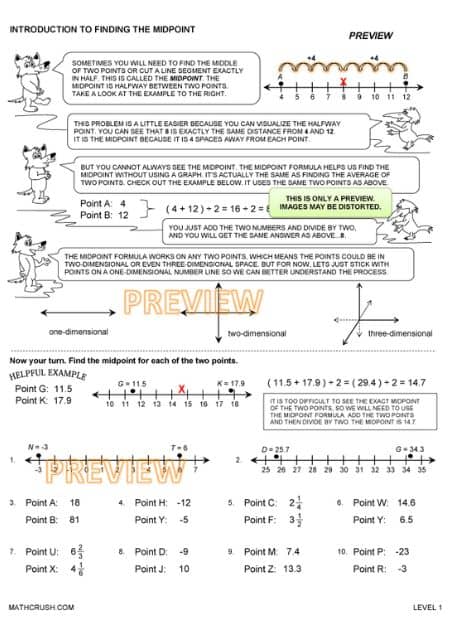
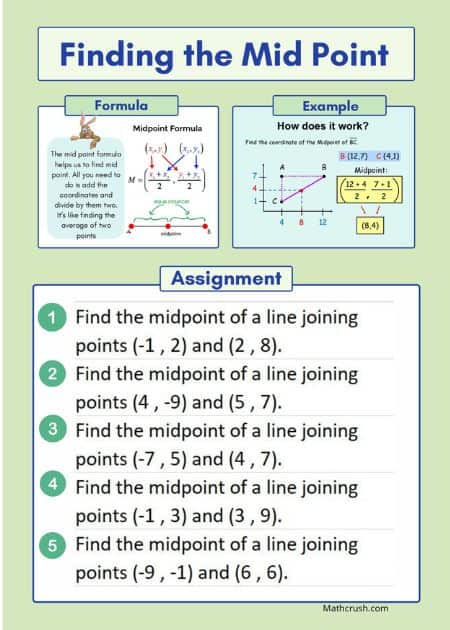
Introduction to Finding the Midpoint Worksheet – Level 1
This one page worksheet introduces the concept of midpoint and how to find it. It only covers basic number lines.
Prior knowledge: Students should already know how to find the average of a group of numbers. The midpoint formula is actually the same as finding the average of two numbers.
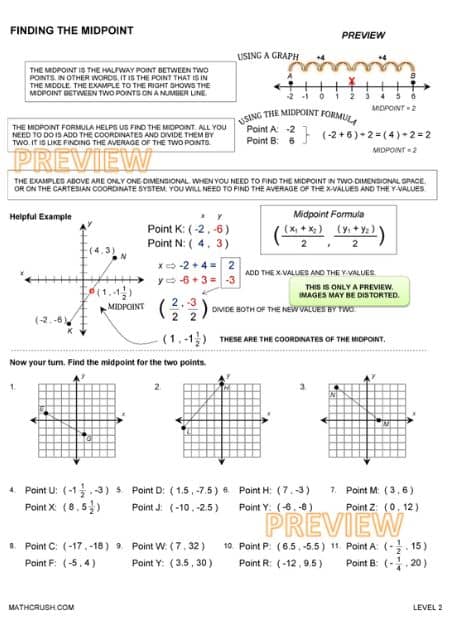
Finding the Midpoint Worksheet – Level 2
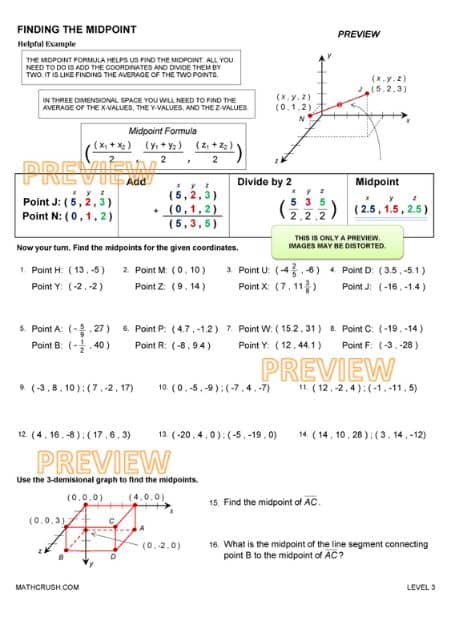
Finding the Midpoint Worksheet Level 3
This one page worksheet finishes the concept of finding the midpoint and how to find it. It covers two-dimensional and three-dimensional graphs.
Prior knowledge: Students should already know how to plot points on an x-axis, y-axis, and z-axis and be able to find the average of a group of numbers.
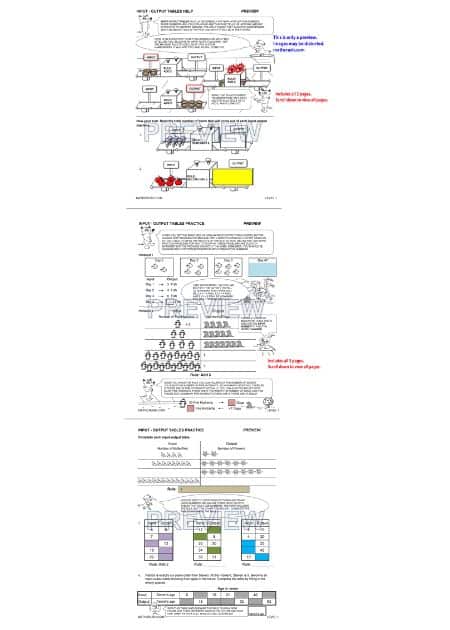
Input – Output Tables Workbook – Level 1
This three page mini-packet introduces input-output tables. It uses pictures to explain the basic concept of the tables. Students complete the tables by drawing pictures and filling in the correct amounts.